Lighthouse: User Timing marks and measures
Overview
Web performance optimization requires an understanding of what is taking how much time to load on your webpage. In many modern websites, JavaScript is often responsible for the sub-optimal performance experienced by your visitors.
The User Timing API allows you to measure your application's JavaScript performance. You can do so by inserting API calls in your JavaScript files and extracting timing data that can help you visualize how JavaScript is running on your page.
How does your site score on this audit?
What does this audit mean?
You can use the extracted timing information to guide you in your website optimization efforts.
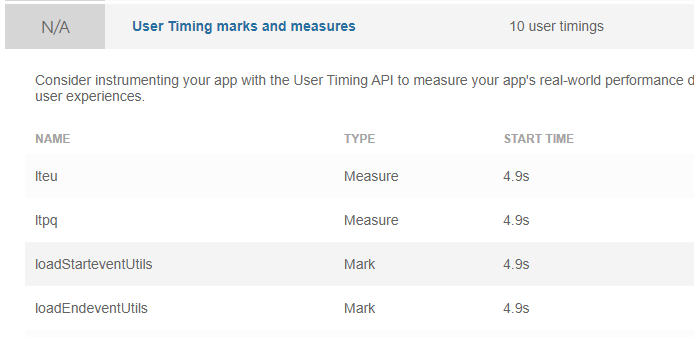
If your web application uses the User Timing API, you'll see the marks and measures in your webpage's GTmetrix Report.
The marks are time stamps that represent when the events started, and the measures represent how much time has passed between marks.
Note that this audit doesn't directly contribute to your Structure Score, but is simply there to guide you in your web optimization efforts.
How does GTmetrix trigger this audit?
GTmetrix displays your marks and measures if your webpage uses the User Timing API. Click the audit to reveal the associated marks and measures data.

Note that this audit doesn't have an impact score. It is simply another way to measure your application performance, which some developers may find highly useful.
How to set your own User Timing marks and measures?
As mentioned above, the User Timing API allows you to set your own marks and measures to analyze your JavaScript performance.
Read this document to learn more on how to use the User Timing API.